HACCP FLOW PROCESS CHART
By. Najih - 06 May 2023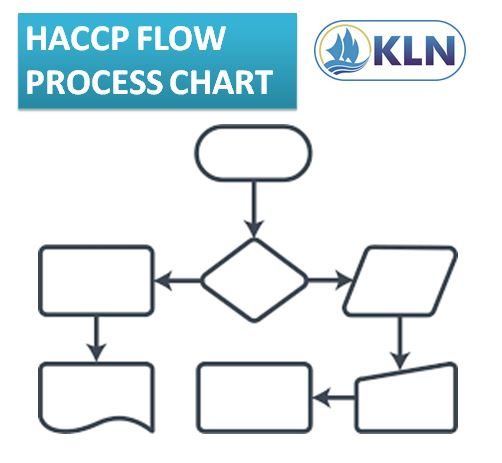
kelolalaut.com - The HACCP flow process chart is a graphical representation of the entire manufacturing process of the food business. It represents the flow starting from receiving raw material until finished example: receiving raw materials, washing, scaling, gutting, de-heading, filleting, sizing, panning, freezing, packing, labeling, storing, and distributing. So, every single product has different types of steps and may have many more or fewer steps. It should be in a simple format but clearly able to be interpreted.
The accuracy of the flow diagram is critical in conducting a hazard analysis. Each step in a flow chart must be assessed for potential hazards and used to identify the critical control points in the process. Once the flow diagram is completed, it needs to be verified. Verification of the flow process chart may be the most important part because a missed step could result in a hazard not being identified. A physical assessment of the plant and process should be completed with the diagram in hand to determine if anything is missing. The easiest way to verify the flow process is to grab a copy of the flow process (that have documented) and physically walk the process from start to finish. Look to see that we have included all steps on our documented chart and also check that we don’t have steps documented on our chart that don’t actually exist in real life. Three categories of verification time: annually at a minimum every 12 months, whenever there has been a change to production processes, and whenever introducing a new ingredient that can have a significant impact on the process e.g. a raw material containing an allergen. The HACCP team should confirm the processing operation against the flow diagram during all stages and hours of operation and amend the flow diagram where appropriate.

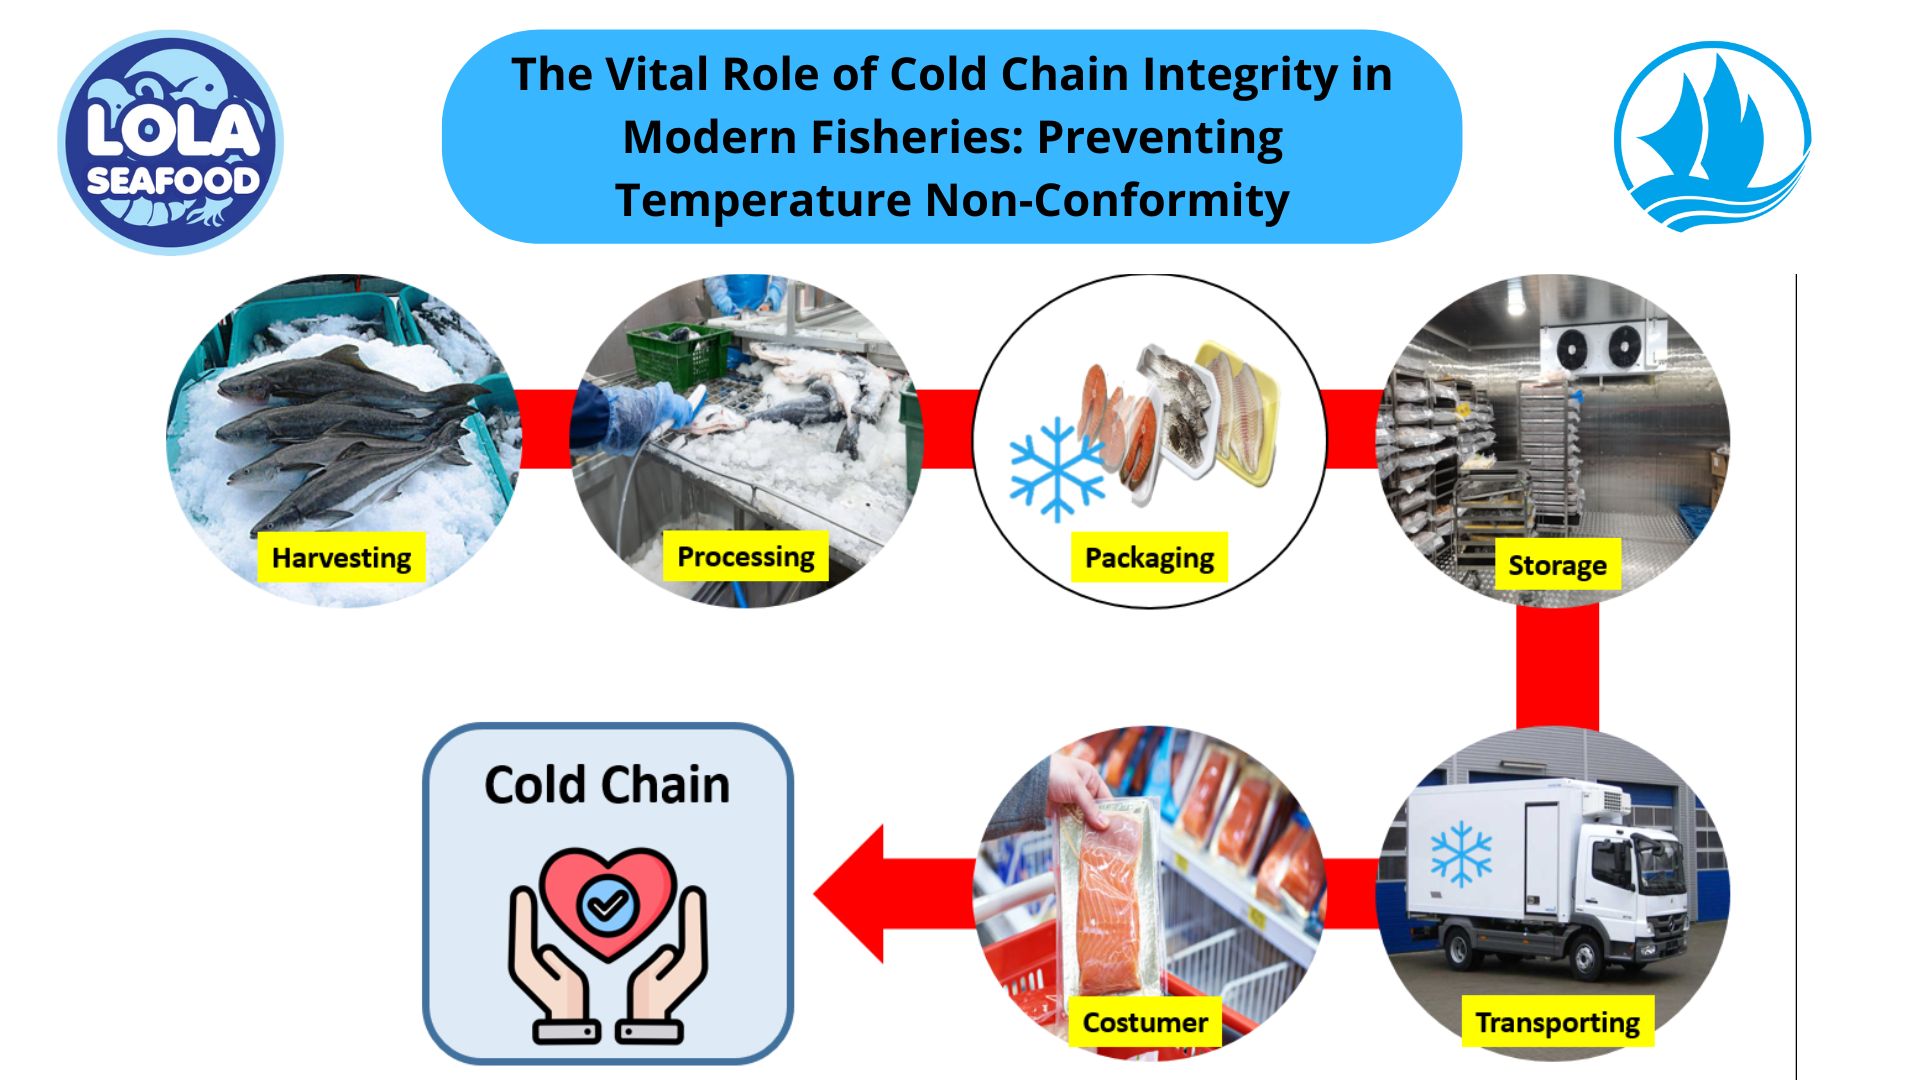
Optimizing Wild-Caught Fish Logistics: Maintaining Thermal Core Integrity During Long-Haul Transport
.jpg)

.jpg)

 and Employee Productivity on the Demersal Fish Processing Floor.jpg)
